


Opinion
4 How to build a real-time dashboard using AWS Amplify, AppSync and Lambda [Part 4]
Published on 26 Nov, 2020 by Gishan
Here we are, the final part of our how-to guide (see Part 1, Part 2 and Part 3, which involves connecting a React frontend to the AppSync API.
Part 4 - how to connect a React frontend to the AppSync API for visualising real-time data on a time series plot.
Step 1: Install Amplify libraries and create services
Install Amplify libraries
Go inside the React project folder and run the following command:
npm install aws-amplify @aws-amplify/ui-react --saveThen open the src/index.tsx file and add the following code to the top:
import awsExports from "./aws-exports";
import Amplify from "aws-amplify";
import PubSub from "@aws-amplify/pubsub";
import API from "@aws-amplify/api";
Amplify.configure(awsExports);
API.configure(awsExports);
PubSub.configure(awsExports);
Create model classes
Now we are going to create two classes for handling all the GraphQL Create, React, Update and Delete (CRUD) operations.
First, create a new folder called services at src/. Then create a folder called models at src/services.
Create a new class called GraphQLAPIWrapper.ts at src/services/ and copy the below code into it. This class acts as the generic wrapper for performing CRUD operations with the AppSync GraphQL API.
import { API, graphqlOperation } from "aws-amplify";
import { GraphQLResult, GRAPHQL_AUTH_MODE } from "@aws-amplify/api";
export interface GraphQLOptions {
  id?: string;
  input?: object;
  filter?: object;
  sort?: object;
  limit?: number;
  variables?: object;
  authMode?: GRAPHQL_AUTH_MODE;
}
async function callGraphQL<T>(
  query: any,
  options?: GraphQLOptions
): Promise<GraphQLResult<T>> {
  return (await API.graphql(graphqlOperation(query, options)))
         as GraphQLResult<T>;
}
export default callGraphQL;
Create another class called EngineModel.ts at src/services/models/ and copy the below code into it. This class acts as our data model and provides the mapping functionality for GraphQL Engine data model.
import { GraphQLResult } from "@aws-amplify/api";
import { GetEngineQuery, ListEnginesQuery, CreateEngineMutation } from "../../API";
interface IEngine {
  id: string;
  unitNumber: number;
  createdAt: string;
  updatedAt: string;
}
function mapCreateEngineMutation(createEngineMutation: GraphQLResult<CreateEngineMutation>): IEngine {
const engine = createEngineMutation.data?.createEngine;
  return ((
           {
             id: engine?.id,
             unitNumber: engine?.unitNumber,
             createdAt: engine?.createdAt,
             updatedAt: engine?.updatedAt,
           } as IEngine) || undefined
         );
}
function mapGetEngineQuery(getEngineQuery: GraphQLResult<GetEngineQuery>): IEngine {
  const engine = getEngineQuery.data?.getEngine;
  return ((
           {
             id: engine?.id,
             unitNumber: engine?.unitNumber,
             createdAt: engine?.createdAt,
             updatedAt: engine?.updatedAt,
           } as IEngine) || undefined
   );
}
function mapListEnginesQuery(listEnginesQuery: GraphQLResult<ListEnginesQuery>): IEngine[] {
return (
    listEnginesQuery.data?.listEngines?.items?.map((engine) => (
         {
           id: engine?.id,
           unitNumber: engine?.unitNumber,
           createdAt: engine?.createdAt,
           updatedAt: engine?.updatedAt,
         } as IEngine)
     ) || []);
}
export default IEngine;
export { mapCreateEngineMutation as mapCreateEngine, mapGetEngineQuery as mapGetEngine, mapListEnginesQuery as mapListEngines };
We need to create a similar class for the ConditionMonitoringDataRecord GraphQL model. Create a class called ConditionMonitoringDataModel.ts at src/services/models/ and copy the below code into it.
import { GraphQLResult } from "@aws-amplify/api";
import { SearchConditionMonitoringDataRecordsQuery } from "../../API";
interface IConditionMonitoringData {
  id: string;
  unitNumber: number;
  dateTime: string;
  data: JSON;
  createdAt: string;
  updatedAt: string;
}
function mapListConditionMonitoringDataQuery(searchQuery: GraphQLResult<SearchConditionMonitoringDataRecordsQuery>): IConditionMonitoringData[] {
const filteredDataRecords =
searchQuery.data?.searchConditionMonitoringDataRecords?.items?.map(
(dataRecord) => (
          {
            id: dataRecord?.id,
            unitNumber: dataRecord?.unitNumber,
            dateTime: dataRecord?.dateTime,
            data: JSON.parse(dataRecord?.data ?? ""),
            createdAt: dataRecord?.createdAt,
            updatedAt: dataRecord?.updatedAt,
          } as IConditionMonitoringData)
) || undefined;
return filteredDataRecords || [];
}
export default IConditionMonitoringData;
export { mapListConditionMonitoringDataQuery as mapListConditionMonitoringData };
Create service classes
Now we are going to create two service classes that use the model classes. The component classes that will be created in the next step will communicate with the AppSync API through the service classes.
Create a new class called EngineAPIService.ts at src/services/ and copy the below code into it.
import { CreateEngineInput, CreateEngineMutation, GetEngineQuery, ListEnginesQuery } from "../API";
import IEngine, { mapCreateEngine, mapGetEngine, mapListEngines } from "./models/EngineModel";
import callGraphQL from "./GraphQLPAPIWrapper";
import { createEngine } from "../graphql/mutations";
import { getEngine, listEngines } from "../graphql/queries";
class EngineAPIService {
public async createEngine(input: CreateEngineInput):Promise<IEngine> {
try {
     const response = await callGraphQL<CreateEngineMutation>
     (createEngine, {input: input});
     const newEngine = mapCreateEngine(response);
     return newEngine;
   } catch (error) {
     console.error(EngineAPIService.name, "createEngine", error);
     throw error;
   }
}
public async fetchEngine(engineId: string): Promise<IEngine>
{
  try {
     const response = await callGraphQL<GetEngineQuery>
     (getEngine, {id: engineId});
     const engine = mapGetEngine(response);
     return engine;
  } catch (error) {
     console.error(EngineAPIService.name, "fetchEngine", error);
     throw error;
  }
}
public async listEngines(): Promise<IEngine[]> {
  try {
      const response = await callGraphQL<ListEnginesQuery>
      (listEngines);
      const engines = mapListEngines(response);
      return engines;
  } catch (error) {
      console.error(EngineAPIService.name, "listEngines", error);
      throw error;
  }
}
}
export default EngineAPIService;
Next, create another class called ConditionMonitoringDataService.ts at src/services/ and copy the below code into it.
import IConditionMonitoringData, { mapListConditionMonitoringData } from "./models/ConditionMonitoringDataModel";
import { SearchableIntFilterInput, SearchableConditionMonitoringDataRecordFilterInput, SearchableConditionMonitoringDataRecordSortableFields, SearchableSortDirection, SearchableConditionMonitoringDataRecordSortInput } from "../API";
import { SearchConditionMonitoringDataRecordsQuery } from "../API";
import callGraphQL from "./GraphQLPAPIWrapper";
import { searchConditionMonitoringDataRecords } from "../graphql/queries";
class ConditionMonitoringDataAPIService {
public async listConditionMonitoringData(unitNumber: number): Promise<IConditionMonitoringData[]> {
try {
const filterInput = {
unitNumber: {
eq: unitNumber
} as SearchableIntFilterInput} as.
SearchableConditionMonitoringDataRecordFilterInput;
const sortInput = {
field:SearchableConditionMonitoringDataRecordSortableFields.dateTime,
direction: SearchableSortDirection.asc
} as SearchableConditionMonitoringDataRecordSortInput;
const limit = 100;
const query = await callGraphQL<SearchConditionMonitoringDataRecordsQuery>(searchConditionMonitoringDataRecords, {
filter: filterInput,
sort: sortInput,
limit: limit
});
const records = mapListConditionMonitoringData(query);
return records;
} catch (error) {
throw error;
}
}
}
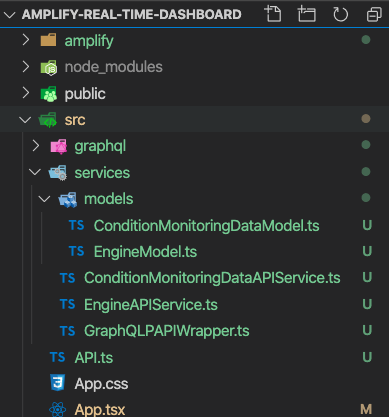
export default ConditionMonitoringDataAPIService;Finally, the project folder should look like the following:

Step 2: Create the Amplify auth component
The hard part is now done! Let’s get to the simple stuff.
Amplify provides us with an Auth component that automatically handles Cognito user account sign up, sign in, sign out and reset password functionalities.
Open the App.tsx and replace its content with the following:
import React from "react";
import "./App.css";
import { withAuthenticator, AmplifySignOut } from "@aws-amplify/ui-react";
function App() {
return (
<div className="App">
<AmplifySignOut />
</div>
);
}
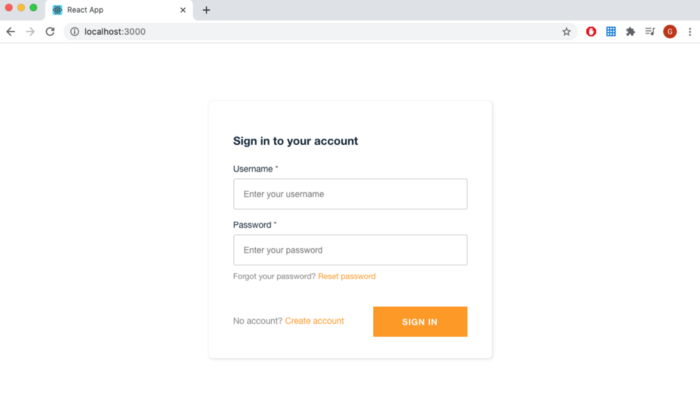
export default withAuthenticator(App);Run the React app using npm start and you will see the Amplify auth component in your browser.
Go ahead and create yourself an account. Once the account is created you will be automatically signed in.

Step 3: Create the dashboard component
Now we want to create a new component for visualising the real-time data on a time series plot. For this, we are going to use the Chart.js library [1] (https://www.chartjs.org/).
Open a new terminal window and run the following two commands:
npm install chart.js --save
npm install @types/chart.js -d --save
Create a new folder called components at src/. Then create another folder called dashboard at src/components/.
Copy the below code into a new React file called dashboard.tsx and save it at src/components/dashboard. This contains the code for our time series plot.
import React from "react";
import Chart from "chart.js";
Chart.defaults.global.defaultFontFamily = "Roboto, sans-serif";
Chart.defaults.global.defaultFontSize = 15;
interface IProps {}
interface IState {}
class Dashboard extends React.Component<IProps, IState> {
  canvasRef: any;
  chart: Chart | undefined;

  constructor(props: IProps) {
    super(props);

    this.state = {};
    this.canvasRef = React.createRef();
}
componentDidMount() {
  this.chart = new Chart(this.canvasRef.current, {
  type: "line",
  data: {
    labels: [],
    datasets: [
       {
         data: [],
         fill: false,
         pointRadius: 0,
         borderColor: "rgba(255, 99, 132, 1)",
       },
    ],
   }
  options: {
     legend:{
       display: false
     },
     elements: {
       line: {
         tension: 0,
      },
     },
     title: {
       display: true,
       text: "Time Series of Engine 1 Condition",
       fontSize: 15,
     },
     scales: {
       yAxes: [
         {
           ticks: {
             beginAtZero: true,
           },
           scaleLabel: {
             display: true,
             labelString: "Normalised Sensor Value",
             fontSize: 15,
           },
           gridLines: {
             drawOnChartArea: true,
           },
         },
       ],
       xAxes: [
        {
          type: "time",
          distribution: "series",
          time: {
            unit: "minute",
            displayFormats: {
              minute: "HH:mm MMM DD",
            },
          },
          scaleLabel: {
            fontSize: 10,
          },
        }
       ]
     }
   }
 });
}
render() {
  return (
    <React.Fragment>
      <canvas ref={this.canvasRef} />
    </React.Fragment>
  );
}
}
export default Dashboard;
Then open the App.tsx file and replace the App() function with the following:
function App() {
return (
<div className="App">
<AmplifySignOut />
<div>
<Dashboard />
</div>
</div>
);
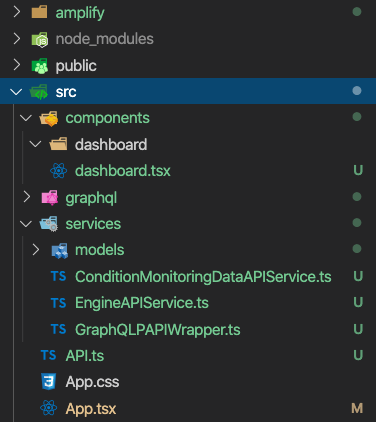
}After creating all the model, service and component classes, your project folder should look like the below figure.

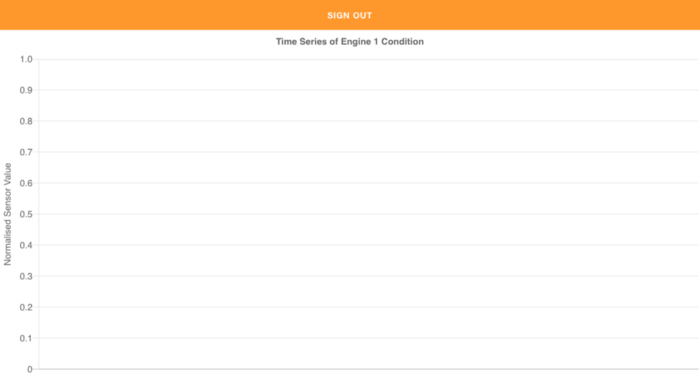
Now hit npm start to run the React App. After signed in, you will see the time series plot.

Step 4: Subscribing to real-time data
In this step, we are going to plot real-time condition monitoring data on the time series. This is where AppSync GraphQL Subscriptions will come into play [3].
First, add the below imports to the top of dashboard.tsx file.
import { API, graphqlOperation } from "aws-amplify";
import * as subscriptions from "../graphql/subscriptions";
Then declare a class variable called subscription.
class Dashboard extends React.Component<IProps, IState> {
  subscription: any;
  ......
}
Finally, add the following two functions above the componentDidMount() function in the dashboard.tsx file.
The subscribeToData() creates a subscription on Sensor 4 of Engine 1 - yes, AWS AppSync has subscription arguments [4]!
subscribeToData() {
  this.subscription = (API.graphql(graphqlOperation(
        subscriptions.onConditionMonitoringDataRecord, {
              unitNumber: 1, //Unit number of engine 1.
        })
  ) as any).subscribe({ next: (response: any) => {
        console.log(response);

       if (response["value"]["data"]
           ["onConditionMonitoringDataRecord"]) {
          const dateTime = response["value"]["data"]
              ["onConditionMonitoringDataRecord"]["dateTime"];
const cmData = response["value"]["data"]
              ["onConditionMonitoringDataRecord"]["data"];
if (cmData) {
             const value = JSON.parse(cmData)["S4"];
             if (this.chart?.data.datasets &&
                 this.chart?.data.datasets[0].data) {
                  this.chart?.data.datasets[0].data.push(
                     {
                       t: dateTime,
                       y: Number(value),
                     } as any);
this.chart?.update();
            }
           }
         }
       }
  });
}
In the componentWillUnmount() function, we are deleting the subscription when the React component is ready to unmount.
componentWillUnmount() {
  this.subscription.unsubscribe();
}
Ok, that’s all the coding done!
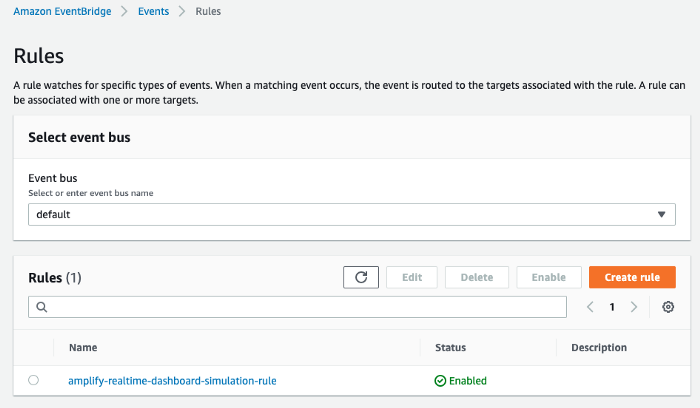
Now we need to start the simulation. Go to the AWS EventBridge service in your AWS Console and enable the simulation rule.

Now start the React app by running npm start. Wait for a few minutes.

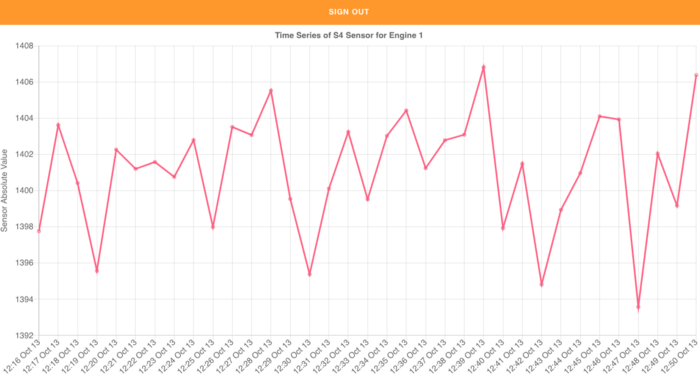
BIG Voilà! We are now plotting a time series as condition monitoring data being transmitted by the engines every minute.
Important: Make sure to stop and reset the simulator once you are done (see Step 5 in Part 3.
Conclusion
In this blog, we learned how to build a near-real-time (one-minute frequency) data dashboard using AWS Amplify, AppSync and Lambda.
I hope you’ve enjoyed this blog and more importantly, learned something new.